Read the Overview dashboard
The Overview answers one question for the entity chosen in the header and everything below it: is everything up, and what is at risk? This article explains each zone, how to read states, what each key figure measures and what to do when one changes.
Anatomy of the Overview
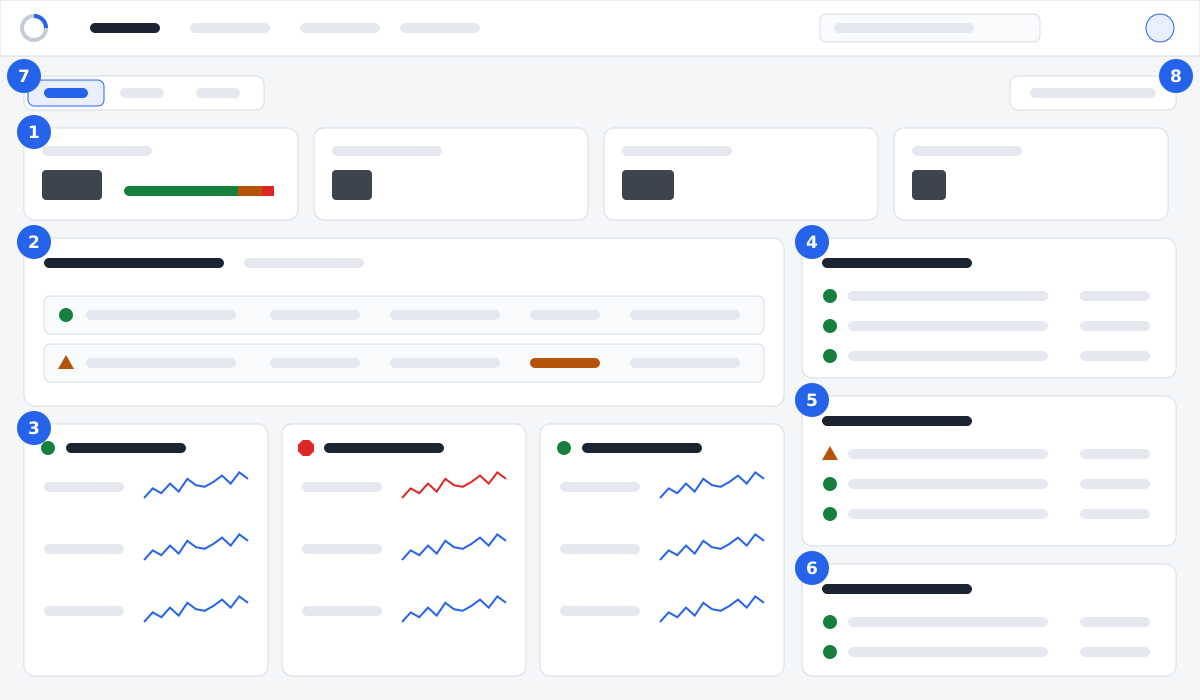
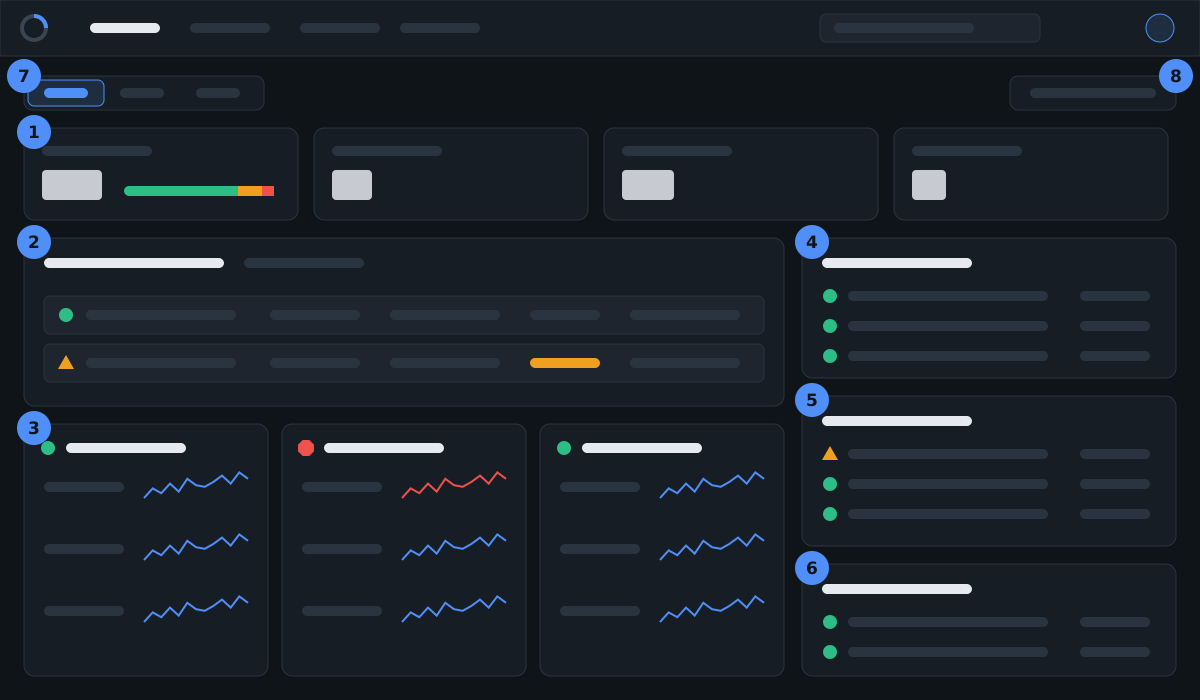
| Zone | What it shows | What to do | |
|---|---|---|---|
| 1 | Key figures | Resources with a bar of their states, open alerts by severity, alerts you have not seen (and how many nobody acknowledged) and items expiring within 30 days. Each figure opens the list behind it | Start here. A number that grew since your last look is your first lead |
| 2 | Availability groups | For each Always On availability group: listener, primary, last failover, backup preference, and every replica with its role, commit mode, health, send and redo queues, redo rate and lag. Below them, each database with its synchronization state, flagged when the replicas disagree or data movement is suspended | A replica that is not Healthy outranks any single server. Look at the databases to see which ones are behind |
| 3 | Resource cards | One card per resource, worst first: state, type, up to four tags, open alerts and the key metrics of its type, each with its value and a 60-minute sparkline | Select a card to open the resource's charts, checks and timeline |
| 4 | Synthetic checks | Tests that exercise real paths, such as listener name resolution, linked servers, web endpoints and report rendering, with their last result and how many fail | A failing synthetic check means users feel it, even when every server looks healthy |
| 5 | Expiry and risk | Certificates and domains that expire within 30 days, soonest first; resources with nothing collected yet; and critical resources whose criticality is 4 or 5. Other expiring items, such as Key Vault secrets, count in the key figure and appear on the Checks tab of their resource | Assign an owner to each item before it becomes an outage |
| 6 | Sources | Each source (the Excubius collector, New Relic, NinjaOne, Azure Monitor) with its ingest mode, whether its data is Fresh, Stale or Never seen, and when it last reported | Stale data makes every other zone unreliable. Tell an administrator |
| 7 | Views | Cards, Hex and Tree: three views of the same data | Pick the one that fits the size of the estate (see below) |
| 8 | Wall display | Opens the current view without menus, refreshing every 10 seconds, with larger type and a clock | Use it on a screen in the operations room |
The Overview refreshes on the rhythm you chose in personal settings, every 30 seconds by default.
States, colours and shapes
Excubius never shows a state with colour alone: every state has its own shape and word, so the dashboard reads the same for colour-blind users, in greyscale and on a phone in sunlight.
| State | Shape | Means |
|---|---|---|
| Healthy | Circle with a tick | Every check within its thresholds |
| Warning | Triangle | At least one check above its warning threshold |
| Critical | Octagon | A critical threshold crossed, a check failing, or the resource unreachable |
| Unknown | Dashed circle with a question mark | No check has produced a result yet |
| Maintenance | Dashed circle, with the word Maintenance | Inside a maintenance window: alerts are recorded, notifications wait |
| Silenced | Bell crossed out | Every open alert of this resource is silenced for a while |
Checks that are still learning, or that only report information, count as healthy for the resource's state.
Key figures in detail
| Figure | Measures | Healthy reading | Worry when |
|---|---|---|---|
| Resources | Every monitored resource of the entity and below, split by state. Discovered databases and linked servers follow their instance and are not counted again | Almost all green | The red or grey part of the bar grows |
| Open alerts | Alerts not yet resolved, by severity, security findings included | Few, and all acknowledged | A critical alert has no acknowledgement after a few minutes |
| Not seen by me | Active alerts you have not opened yet, with how many nobody acknowledged. When your installation does not track who has seen what, this figure shows Not acknowledged instead | Zero at the end of your shift | It keeps growing: nobody is triaging |
| Expiring within 30 days | Certificates, domains, secrets and keys that expire soon | Zero, or each item has an owner | Anything under 7 days, which is critical |
Three views of the same data
- Cards: detail per resource. Best for a team that knows its estate.
- Hex: one hexagon per resource, coloured and shaped by state, grouped by a tag key you choose under Group by, such as
envorclient, or with No grouping. Best for many resources or a quick scan. - Tree: the entity hierarchy with resources and open alerts per branch. Select a branch to see its own Overview.
Your choice is remembered on this device, and it is part of the address (?view=hex), so a link you share opens the same view. Until you choose, the Overview opens on the view of your First screen after signing in setting.
The wall display has its own address, the Overview's with ?kiosk=1 (add &view=hex for the hex map), so a screen can open it directly. Exit wall display returns to the normal screen. Pair it with the Ops room (high contrast) theme.
Everything on the Overview is limited to the entities your role lets you see. Two colleagues can open the same address and see different numbers.
When nothing is monitored in the selected entity yet, the Overview says so. Entity admins see the three steps to add a first resource; everyone else is asked to contact an entity admin.